Objective 2: Improved methods for the sampling of biofuels; exploiting data science techniques
To develop improved methods for the sampling of biofuels (i.e. in cases where online methods cannot be used). This should include using data-science techniques such as machine learning to optimise calibration curves and uncertainties.
Typically, if laboratory analysis is required only a minor portion of the material is analysed and, in this case, sampling is critical. The sampling technique employed can have a major impact on the total system uncertainty especially if the sample material is heterogenous, which often is the case for biofuel materials. Standards for the sampling of biofuels exist (ISO 18135:2017) but are difficult to use in practice, e.g. in the case when truckloads of wood chips are to be investigated, the major contribution to the uncertainty of the measured water content originates from sampling.
The development of automated sampling systems for biofuel materials in the project together with theoretically based sampling principles provides a solution to the sampling issue that ensures that proper sampling techniques can be applied widely. In the initial phases of the project, the metrological foundation for sampling activities was researched. A survey conducted among producers, consumers, and laboratories provided information of stakeholders’ requirements. Based on this, prior knowledge of the project partners, and a literature survey a report named “Sampling and Samples Handling Strategies” was produced by DTI, CETIAT, VERDO, and PROMETEC. The report covers the present sampling and sample handling methods. In the report, the pros and cons of the methods are discussed, and suggestions are made on how to solve solid biofuel quality controlling issues.
Vast experimental research was made on the power plant sites of two collaboration partners with two automated samplers (Q-Robots) during the project. The involvement of the power plants was essential since the Q-Robots were installed on both sites. In the project, one of the objectives was to develop the sampler’s sampling auger to better suit the biomass material classified as P100 (i.e. the main fraction is less than 100 mm). Two comparison studies were made during the project between samples collected by Q-Robot and collected manually by truck drivers, professionals, and a professional consultant from VTT (Technical Research Center of Finland) - Figure 9. The tests with the Q-Robot were made at two different sites owned by Kuopion Energia and Kainuun Voima using identical Q-Robots. The goal was to find out the reliability of automated sampling with a new 250 mm auger whose design was based on biomass class P100 requirements (Figure 10).
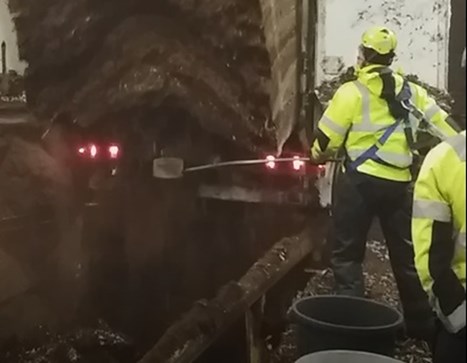
Figure 9. VTT professional consultant collecting manual samples.
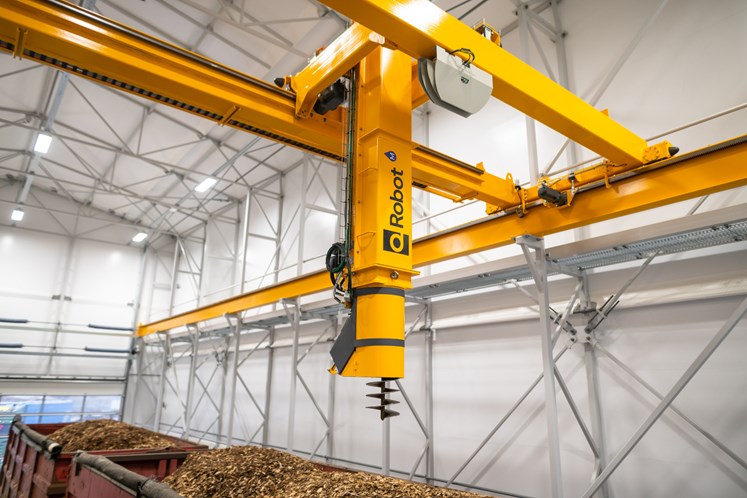
Figure 10. Prometec’s fully automated sampling robot.
A comparative study carried out by a consultant from VTT that routinely works with sampling according to ISO 18135:2017, was made in November 2020 at Kuopio Energy’s power plant. For five days, samples from different types of biofuel loads were collected both using a Q-robot and manually by the VTT consultant. Load-specific samples were taken daily from all loads delivered during the 10-hour test period. Samples for the comparison were collected from a total of 59 loads, of which 26 loads were forest residue chips, 20 loads of whole wood and stem chips, 8 loads of peat and the remaining loads were sawdust and bark.
A second comparative study was made in April 2021 at Kainuun Voima power plant in Kajaani. Samples from different types of biofuel loads were collected in three ways, with a Q-robot, manually according to the documentary standard EN ISO 18135: 2017 and by the truck driver (which is a common way to take samples in Finland). Samples for the comparison were collected from a total of 24 loads, of which 2 loads were forest residue chips, 11 loads of stem wood chips, and 11 loads of crushed stumps.
Moisture and particle size distribution were determined from all collected samples in Prometec’s laboratory. Results from Kuopion Energia were analysed by VTT and DTI. Results from Kainuun Voima were analysed by DTI. The difference in average moisture of all fuel types over the test period between the tested sampling methods was 0.7 percentage points in Kuopio. In Kajaani, the moisture difference was 0.3 percentage points between the standardised method and the Q-robot sampling. Results showed that there are no systematic errors made in moisture or in particle size determination when using a 250 mm wide auger compared to when applying the standardised manual sampling method. There is no overall significant difference between the particle sizes in samples obtained using the standardised method and samples obtained using the Q-robot. There are significant (i.e., detectable) differences between particle sizes, when comparing the Q-robot results to samples obtained by the truck driver.
The objective was achieved. With samples taken by Q-Robot, it was demonstrated that the sampler collects representative samples according to the documentary standard ISO 18135:2017. The results were reproducible, and no systematic errors were observed i.e., this means that this sampling technique can be used widely.
The results have been communicated to European standardisation in the form of a summarising report with a proposal to include automatic sampling using robots in the next update of the standard. The input included information about how the samples should be collected by using an auger and how samples should be collected from randomly chosen places directly from the load before unloading. Collecting samples before unloading enables quick moisture measurement for acceptance checking logistic optimising and billing.
DTI, with support from IST, CMI, CETIAT, and VERDO, have developed a method for the analysis of results of moisture content based on machine learning. The use of data-science techniques, in particular machine learning, for optimising calibration curves for water content to improve uncertainties has been researched.
The technology of machine learning allows to extract the information from so-called big data, and it is possible to find and quantify the effect of correlations between different measurement parameters, which would be difficult or impossible to find otherwise. Thus, machine learning may make it feasible to combine all the readings to determine the water content of biofuel with improved precision compared to using traditional analytic techniques.
The data used to test the machine learning techniques were obtained at a CHP (combined heating and power) plant of VERDO in Randers, where an inline system for water-content measurements is employed at the conveyor belt feeding the boilers. The signal of this system is essential for ensuring optimal combustion efficiency. An existing MW (microwave) system for water-content measurements was supplemented with a NIR (infrared) system and sensors for the characterization of ambient conditions (relative humidity, sample surface temperature, air temperature). In addition, LoD (loss on drying) reference measurements were performed regularly. Since a large dataset is important for the use of machine-learning algorithms, data recorded during the project was supplemented by historic data (containing fewer parameters, but more measurements), and thus about 1000 reference measurements were made available. The machine-learning algorithms used for the research were extended linear regressions based on physical and virtual parameters.
A simple approach was developed to determine the uncertainty contribution related to a machine-learning. The available data were divided into 2 – 3 subsets: 1) a training set, 2) an optional optimisation set, and 3) a validation set. By using the training dataset to develop the machine-learning model, the validation dataset could be used to determine the uncertainty contribution.
An example of a test combining many physical input data is shown in Figure 11. This turned out to be a very effective approach since in this case, the machine-learning algorithm exploited the correlations between the different data to yield very small uncertainty contribution, 1.6% abs. Another example, based on a much larger data set (of poorer quality, however) and illustrated in Figure 12, utilized virtual parameters (in the form of combinations of the physical parameters) to exploit possible correlations for enhanced precision. The result was a smaller scatter of the data in the training set, but the test on the validation set revealed that uncertainty contribution was not improved significantly. In addition, it was discovered that the homogenous distribution of the training data over the measurement range (obtained by reducing the training set - Figure 12) was a prerequisite for establishing a good machine-learning model.
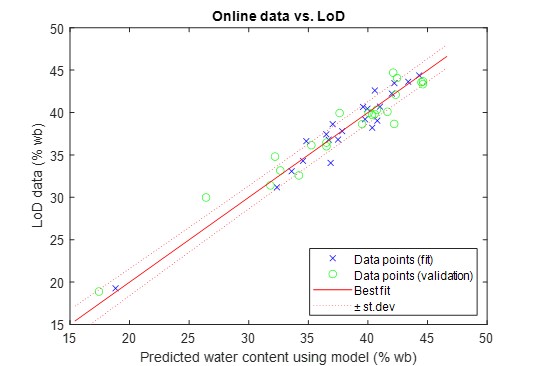
Figure 11. The use of machine learning for the best possible water-content precision of woodchips by combining different sensors (MW + NIR). By splitting the data into several subsets to determine the uncertainty related to machine learning. Standard uncertainty of learning subset (fit): 1.2%; Standard uncertainty of validation subset (validation): 1.6%.
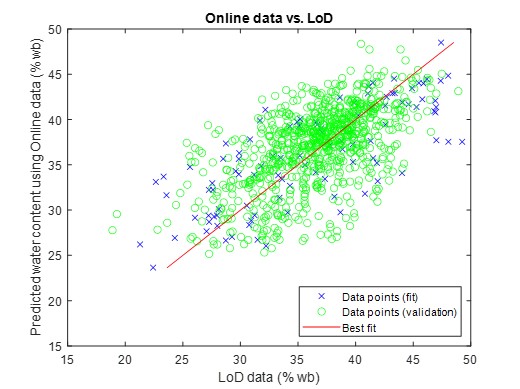
Figure 12. The use of machine learning for the best possible precision of the water content of woodchips using a MW sensor: The machine learning is based on a combination of the physical parameters (phase, attenuation, and load) and virtual parameters (combinations of the physical parameters).
This work has provided essential input to the “Good Practice Guidelines on uncertainty assessment of biofuel measurements“ which is made available to the public on the BIOFMET website.